FAQ - How to use the app
How to track?
OUTPUTS can help you with an easy log of your bowel movements. The triangle button on the main screen is all you need to start tracking. Slide the button when you've completed a bowel movement and the app will automatically log the time and date, no need to enter any additional information or scroll through menus. Slide the button UP when everything is ok, slide it DOWN to indicate a stool problem.
OUTPUTS sums up your logs and shows them on the Calendar and Statistics pages, enabling you to identify patterns or irregularities in your digestive health over time and making it easier to discuss any concerns with healthcare professionals if necessary.
How to choose between GOOD and POOR?
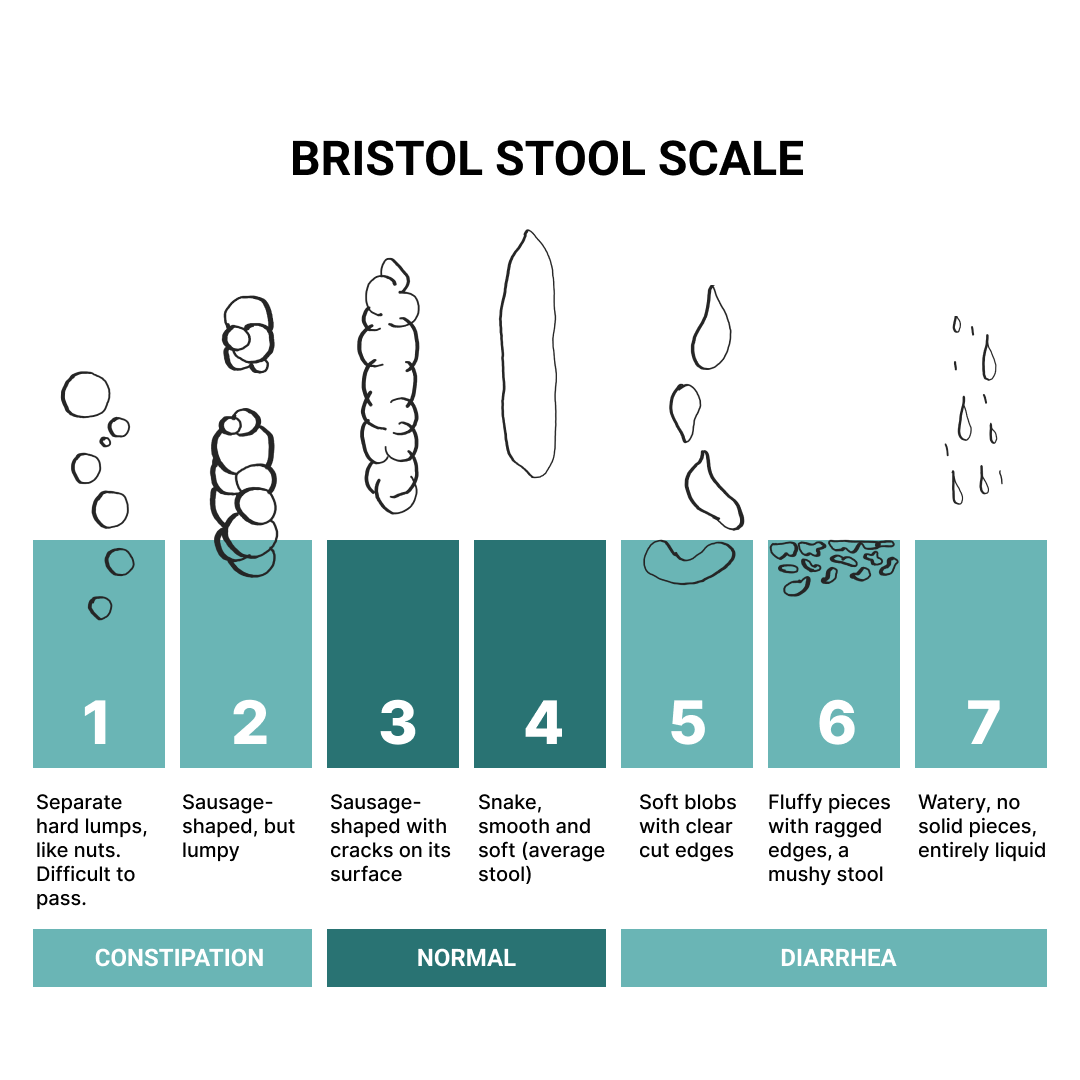
You can define your norm or consult the Bristol Stool Form Scale (BSFS), or Bristol Stool Scale, a tool that can help classify stools into seven groups. Well-formed and easy-to-pass (Types 3 and 4 according to BSFS) stools are considered to be ideal, other types can indicate a problem.
Signs of a healthy bowel can include:
regular bowel movements of well-formed (types 3 and 4) stools
being able to hold on for a short amount of time after first feeling to urge to pass a stool
defecating within roughly a minute of sitting on the toilet
passing a stool without any pain or need to strain
completely emptying the bowel when having a movement
The following situations may suggest a digestive issue:
pooping too often — more than three times daily
not pooping often enough — less than three times a week
excessive straining when pooping
poop that is red, black, green, yellow, or white
greasy, fatty stools
pain when pooping
blood in the stool
bleeding while passing stool
watery poop — diarrhea
very hard, dry poop that is difficult to pass
floating poop
People experiencing any of these situations should consult a doctor.
How to read Timer on the main screen?
Once you create a record, the Timer starts displaying the time and date of that log. Additionally, you can see a time marker (white dot) on the circle, visually indicating this specific time. This information remains unchanged until the next record.
As time progresses, the progress bar grows, allowing you to estimate the amount of time that has passed since the last record. You can also view the elapsed time in the center of the circle, represented in days, hours, and minutes. The complete circle corresponds to 24 hours.
How to view a specific day record?
You can navigate to a specific date using the Calendar view by tapping the day on the Calendar or scrolling a log history below the Calendar.
How private are my records?
Your data is stored securely on your device and is not shared with any external sources. You have full control over your information, and it is up to you to decide whether to share it with healthcare professionals or keep it for personal reference.
How can I delete or edit my record?
Go to Calendar view, find the record card in a log history, tap and hold the card to access the menu.
If I forgot to log in today or any day earlier, how can I add a record?
Go to Calendar view, find the day in a log history, tap and hold to access the menu, tap plus icon.
How to mark a day without an event? And what is the difference between skipped record and missed event?
If nothing happened, just don’t record, there will be a day with an empty log. But there is no difference between skipped records and missed events in the Calendar, History and Statistics. Keep a record on a regular basis, and you will get more out of it.
Can I download or upload data?
Yes, you can do both, it is available on the Statistics screen - upper right corner.
What does the Statistics screen show?
The number of Good records for you to be aware of overall digestive wellbeing. The number of average weekly records to help you detect a hyperactive bowel or a tendency to constipation. Graph with the Daily Pattern to understand how stable your daily schedule is over a chosen period (week, month, year).
How to read the Daily Pattern chart?
The horizontal axis of the chart represents twenty-four one-hour time bins starting from midnight. The vertical axis represents the frequency or count of records made within each time bin over a chosen period (week, month, year). For instance, you made a total of 25 records. Among these, 10 were recorded between 7 AM and 8 AM, 12 between 8 AM and 9 AM, 2 between 6 PM and 8 PM, and 1 was recorded between 10 PM and 11 PM. In this example, the tallest bar corresponds to 12 records within the 8-9 AM time interval, while the shortest bar represents 1 record within the 10-11 PM time interval.
Still have questions?
Contact us support@outputs.health


